

Education
What you should know about MACD

The Moving Average Convergence Divergence (MACD) invented by Gerald Apple in 1979 is one of the most simplest and widely used technical indicators that help traders calculate the direction, strength, duration and momentum of a trend. It turns two trend-following indicators into a momentum oscillator by subtracting the long exponential moving average (EMA) from the short EMA.
The MACD indicator has three main elements: the MACD line which is usually identified as the default blue oscillator (the color can be changed later) – is the 26-period EMA subtracted from the 12-period EMA. The signal line usually represented by the red oscillator is the 9-period EMA of the MACD line. And the third element which is the histogram shows the difference between the MACD line and the signal line. The MACD histogram swings above and below a zero line and it helps in showing bullish and bearish momentum readings.
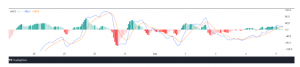
When the MACD is positive, i.e above the signal line, and the histogram is also increasing, this is an indication of an increasing momentum – the price most likely going up which can be interpreted as a buy signal.
On the other hand, when MACD is decreasing and the histogram is decreasing as well, the price tends to drop which can be an indication that the asset needs to be sold.
Note: The MACD is not 100% accurate and can give false signals so it is therefore important to use it with other indicators like volume, RSI or price action.
How to Read MACD Signals
Traders can interpret MACD signals through the following:
Signal Line Crossover
The signal line crossover is the most basic signal that can be leveraged. The signal line shows the moving average of the MACD line. The crossover of the two lines is an indication of likely strong movements. A crossover can be bullish or bearish depending on the position of these lines.
It is a bullish crossover when the short-term EMA crosses over the long-term EMA.
It is bearish when the short-term EMA crosses below the long-term EMA.
Zero Line Crossover
The zero line crossover is similar to the signal line crossover, just that in this case, the MACD line crosses over the zero line instead.
When the MACD line crosses the zero line in an upward direction, it signifies a bullish trend and when it happens the other way round i.e in a downward direction, it signifies a bearish trend.
The farther away from the zero line, the stronger the trend becomes.
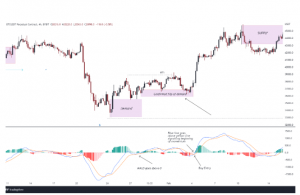
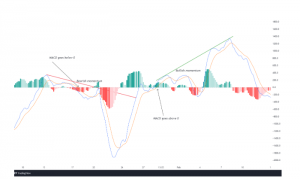
MACD Divergence
This happens when the cryptocurrency price is moving in a direction, but the MACD indicator is moving in a reversed direction. The MACD divergence signifies a possible trend reversal or a probable increase or decline in the cryptocurrency price.
When a cryptocurrency price makes a lower low and the MACD indicator fails to corroborate the price but rather makes a higher low, this is referred to as MACD bullish divergence. This implies that the downtrend is losing momentum and there is a tendency for a price rally. A MACD bullish divergence forming at the end of a downtrend creates an ideal reversal buy signal.
Conversely, MACD bearish divergence occurs when the cryptocurrency price makes a higher high and the MACD indicator resists confirming the price but rather makes a lower high. This means the uptrend is losing momentum and a price decline may occur. When this happens, it creates an ideal reversal sell signal.
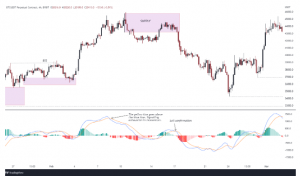
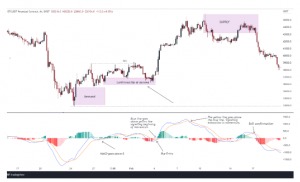
Rapid Rise or Fall
Another signal that can be used with the help of the MACD indicator is how quickly the MACD lines rise or fall. This can occur when the short-term EMA rises or declines faster than the long-term EMA. This is an indication of an oversold or overbought market condition and that the price of the asset will return to its normal state.
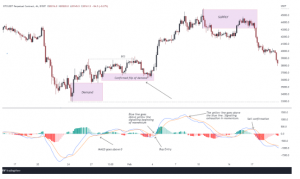
This can be identified on the price chart by checking the distance between the two MACD moving averages; the bigger the space is between two MACD averages, the more the cryptocurrency is oversold or overbought.
Read Also:
Closing Thoughts
MACD is one of the most useful tools in technical analysis. It shows buy and sell signals just by the crossing of lines. It is not only easy to use but also effective at knowing both market trends and momentum whether for a new trader or a professional trader.
However, just like any other technical analysis indicator, the MACD is not accurate at all times and can give off misleading signals. So, traders should not solely rely on the MACD and should make use of other indicators to reduce risk and further confirm the accuracy of the signals.


Pingback: What you should know about MACD by Micah Bamigboye – CryptoTvplus Events: NFT, DeFi, Bitcoin, Ethereum, Altcoin Events
Pingback: How to Survive in a Bear Market | CryptoTvplus: DeFi, NFT, Bitcoin, Ethereum Altcoin, Cryptocurrency & Blockchain News, Interviews, Research, Shows