

Education
What are Candlesticks? How to use them
A trader who wants to be successful should understand how the market works and be able to predict the movement of the market. Candlestick is a powerful tool that a trader can use to identify trends in the market. This article explores what a candlestick is and how to trade the crypto market with it.
What are Candlesticks?
A candlestick is a graphic style used to indicate changes in the price action of the asset being traded over a period of time. Each candle provides four types of relevant information: the opening price, closing price, high, and low.
How to Use Candlesticks
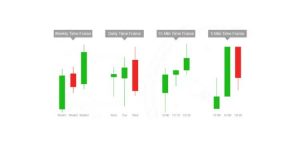
A candlestick provides a good overview of price action during the given period. All available charting tools let you modify the time the candlestick chart displays, from one minute to one week or month.
To understand better, on each given time frame you use, a candle represents one unit of such time frame. For example, if you decide on a one-minute timeframe, each candle will represent one minute, for a weekly timeframe, each candlestick would represent a week and it follows the same principle for other time frames like 15 minutes, 30 minutes, and 1 hour time frames.
This displaying method lets the trader view market sentiment and price action quickly, getting a good insight into price behavior over a definite period.
Note that as a default setting on most candlestick chart providers, the colors green and red are used to represent bullish and bearish candles respectively. However, most of these platforms let their users change the colors to suit their visual preferences.
- The Green Candle means the price has moved up, it is bullish over the given period of the candle.
- The red candle means the price has moved down, it is bearish over the given period of the candle,
- There are lower and higher shadows, popularly called “wicks” and they show the highest and lowest levels of the price reached in the given period of the candlestick
With candlesticks, a trader can understand:
- The Price movement of an asset, how prices act and move in the market.
- Which direction price action has moved
- Whether the price movement is linear or not. (Note; if the candlesticks have wicks on them then they are not linear.
- The highest and lowest price movement within the time of the candle.
Candlesticks depict the price action and movement of a given asset during the specified period. The candlestick can visually display bullish or bearish movement in the market and when Candlesticks are viewed as a group, traders can see candlestick patterns.
Candlestick charts are important in crypto trading. Candlestick patterns can indicate bullish or bearish movements, and a trader can take advantage of the trend by using these indicators.
Important Candlestick Patterns to know
Doji
A Doji candlestick has a small body. This shows that prices opened and closed at similar levels. They mostly represent market indecision. And if you spot a clear trend, this is a sign of a possible trend reversal in the opposite direction. A Doji has 2 major types.
- A dragonfly Doji appears like T shaped figure on the chart. It happens when the open, close, and high prices are on the same level. It indicates that price movement could change direction to the opposite side. That is, if, in a bullish trend, a dragonfly will indicate a bearish reversal the inverse is true for a bearish move with a dragonfly.
- A gravestone Doji is the opposite of a dragonfly. It looks like an upside-down T and happens when the open, close, and low prices are on the same level. Like the dragonfly, it is used to indicate a change in trend or direction.
Hammer
A hammer happens at the end of a downtrend to indicate its completion. It has a short body and a wick that is at least 2 times its body size. They indicate a bullish movement may begin. It shows that the sellers’ pressure is exhausted and buyers are beginning to take over the market. They are usually seen at the end of a bearish trend
Hanging Man
A hanging man has the same concept as the hammer, and looks a lot like it, however, unlike the hammer is seen usually at the end of a bullish movement and indicates a downward reversal. It means a bullish movement is being reversed in the opposite direction.
Belt Hold
Like the 2 patterns mentioned above ,the belt hold indicates a market trend, and the direction may have changed to the opposite direction. It is clearly seen at the end of the previous trend and the beginning of the new trend.
- A bullish belt hold is a sif]=gnal that a downtrend is reversing to the upside. This pattern opens at a price that is substantially lower than the previous candle’s close, followed by a rally, where the high of the candles moves to the midpoint or even higher than the previous candle. Closing very close to the high mark, it leaves a small wick on top.
- A bearish belt hold is indicating that an uptrend is reversing to the downside. It happens in the opposite way. It usually opens higher than the last candle’s high, and drops to the midpoint or lower than the last candle’s low. It also leaves a wick below.
Closing thoughts
This is not an exhaustive guide on how to predict and trade the cryptocurrency market. The focus of this article was to explore how to use candlesticks. There are technical analysis tools and indicators such as RSI, Support and Resistance, etc. that can help you learn how to navigate and successfully trade the crypto market.
What do you think of this article? Share your comments below.


Pingback: What are Candlesticks? How to use them by Chigozie Ohakwe Michael – CryptoTvplus Events: NFT, DeFi, Bitcoin, Ethereum, Altcoin Events
Pingback: How to Trade Crypto Using Support And Resistance | CryptoTvplus: DeFi, NFT, Bitcoin, Ethereum Altcoin, Cryptocurrency & Blockchain News, Interviews, Research, Shows